SIGN UP

BI Dashboards

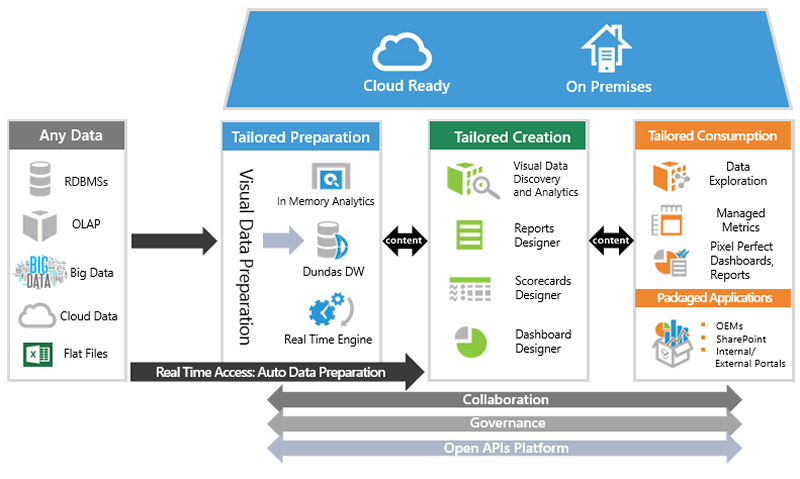
A business intelligence dashboard (BI dashboard) is a data visualization tool that displays on a single screen the status of business analytics metrics, key performance indicators (KPIs) and important data points for an organization, department, team or process.Essential features of modern BI dashboard software include a customizable interface, interactivity and the ability to pull real-time data from multiple sources; these features represent a significant advance over older, static dashboards. BI dashboards are also now an integral component of most leading cloud-based analytics platforms. The popular self-service analytics model -- nearly always delivered from the cloud as SaaS -- is, in large part, based on BI dashboards that enable end users to quickly visualize data they have selected.

Sample Architecture


Cinque Terre

Sisense
Sisense started in the early 2000s as nothing more than an idea: the idea that data analytics can be made fluent, easy, and fast by radically improving data processing capabilities through technological innnovation. After working for six years in stealth mode to perfect our disruptive In-Chip data engine and to tie it into an intuitive, user-oriented front end, Sisense launched its first commercial release in 2010 and caught the market by surprise. Suddenly there was a tool powerful enough to tackle big and disparate datasets, but simple enough to be used by almost anyone. Since then, Sisense has seen meteoric growth that shows no sign of slowing, with headquarters in New York, close to $100 million in funding, and tens of thousands of users across the globe.

Looker
Looker is a new kind of analytics platform that lets everyone in your business make informed decisions - from anywhere. Across industries, today's most data-driven businesses use the Looker platform to do more with their data. Looker Data Sciences (doing business as Looker) is an American computer software company headquartered in Santa Cruz, California. Looker markets a data exploration and discovery business intelligence platform.

Tableau
Tableau provides all types of users with intuitive business intelligence (BI) tools to enhance data discovery and understanding. With simple drag-and-drop features, a user is able to easily access and analyze key data, create innovative reports and visualizations, and share critical insights across the company.Tableau Desktop is a self-service analytics solution that allows you to look at data and answer questions rapidly. Tableau Server enables you to publish dashboards from your Tableau Desktop on any web browser or mobile-based device.

Domo
Domo, Inc is a form of business intelligence (BI) that is a business management platform, delivered as a service, to CEOs and executives. The service is designed to provide direct, simplified, real time access to business data without any IT involvement. It is a software-as-a-service (SaaS) venture. The company's board of directors includes Matt Cohler and Mark Gorenberg.

Qlik Sense
Qlik Sense is a smart and user-friendly analytics tools that can generate personalized reports and very detailed dashboards in an instant. Businesses that are looking for a way to fully explore huge amounts of data and retrieve useful, high-quality insights with surely love Qlik Sense.

Power BI
Power BI is a suite of business analytics tools that deliver insights throughout your organisation. Connect to hundreds of data sources, simplify data prep and drive ad-hoc analysis. Produce beautiful reports, then publish them for your organisation to consume on the web and across mobile devices.